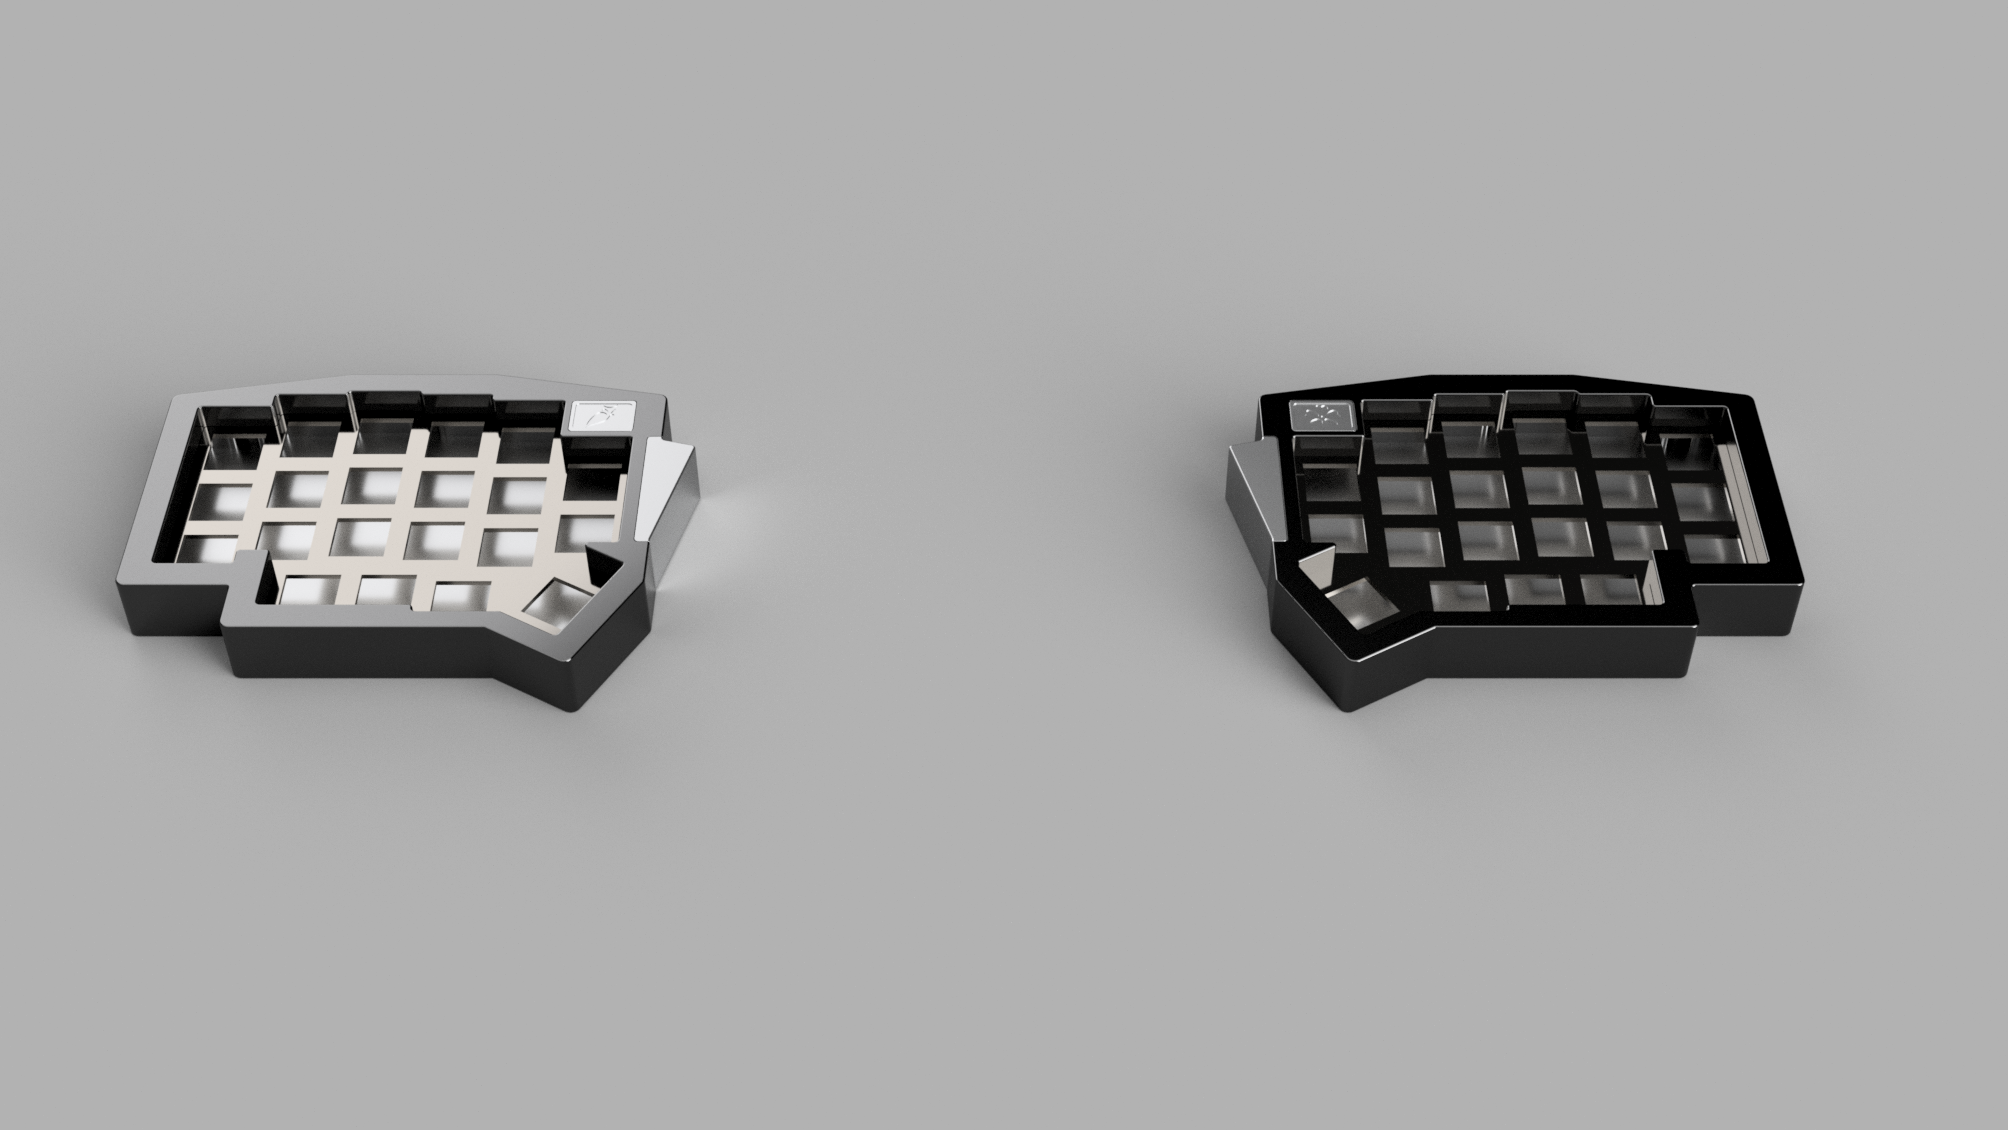
sakura keyboard
I, like everyone else in the world, have a unique style of typing. And while traditional keyboard layouts are more than adequate they aren't quite perfect. So I took the opportunity to learn CAD and eCAD to design and build my own keyboard. I learned how to model parts to fit together, how to route traces on pcbs, and got to experiment with a new way to connect split keyboards. The process took about a year but in the end I was rewarded with a truly unique keyboard that perfectly matches how I type.
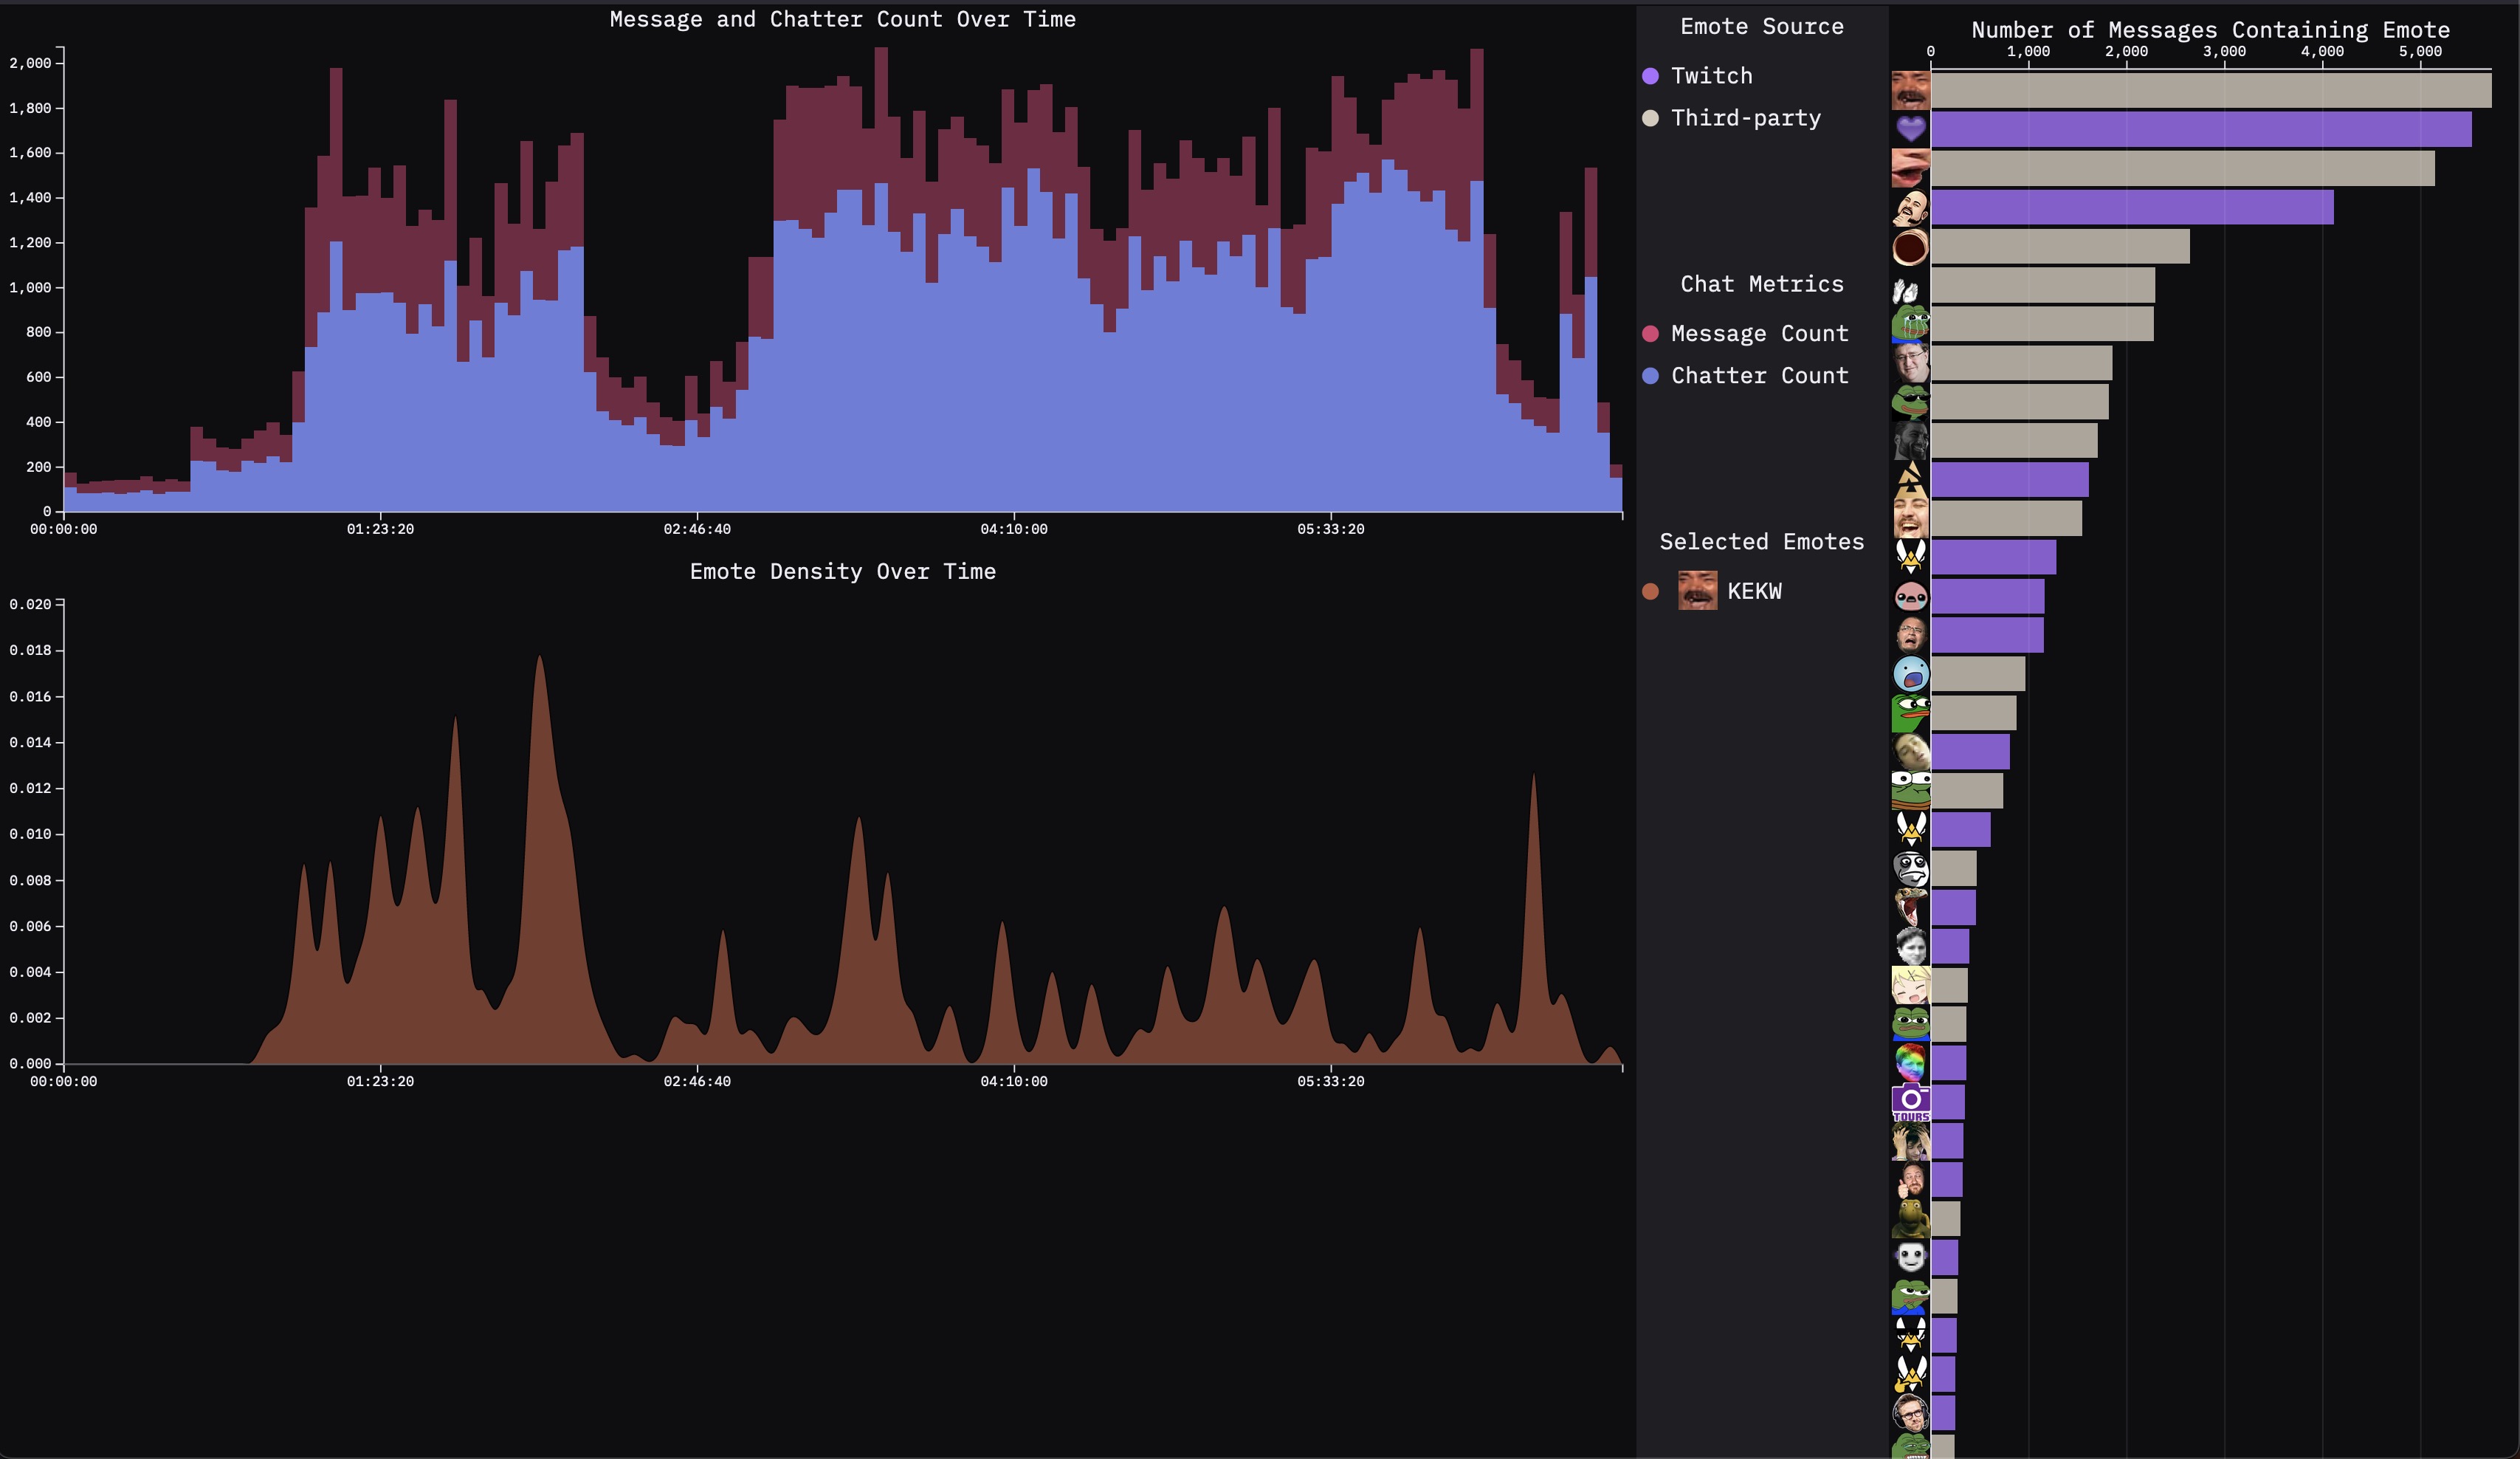
Emote Viewer
Project exploring emote usage during a twitch livestream. Uses video screenshots and chat logs from a CS:GO tournament finals stream. Graphs show message count over time, total emote usage, and emote density over time. Interactions include selectable emotes to see and compare usage, brush zoom on density chart, and showing relevant screenshots when clicked. Data collected and aggregated using Python, visualization built using d3.js.
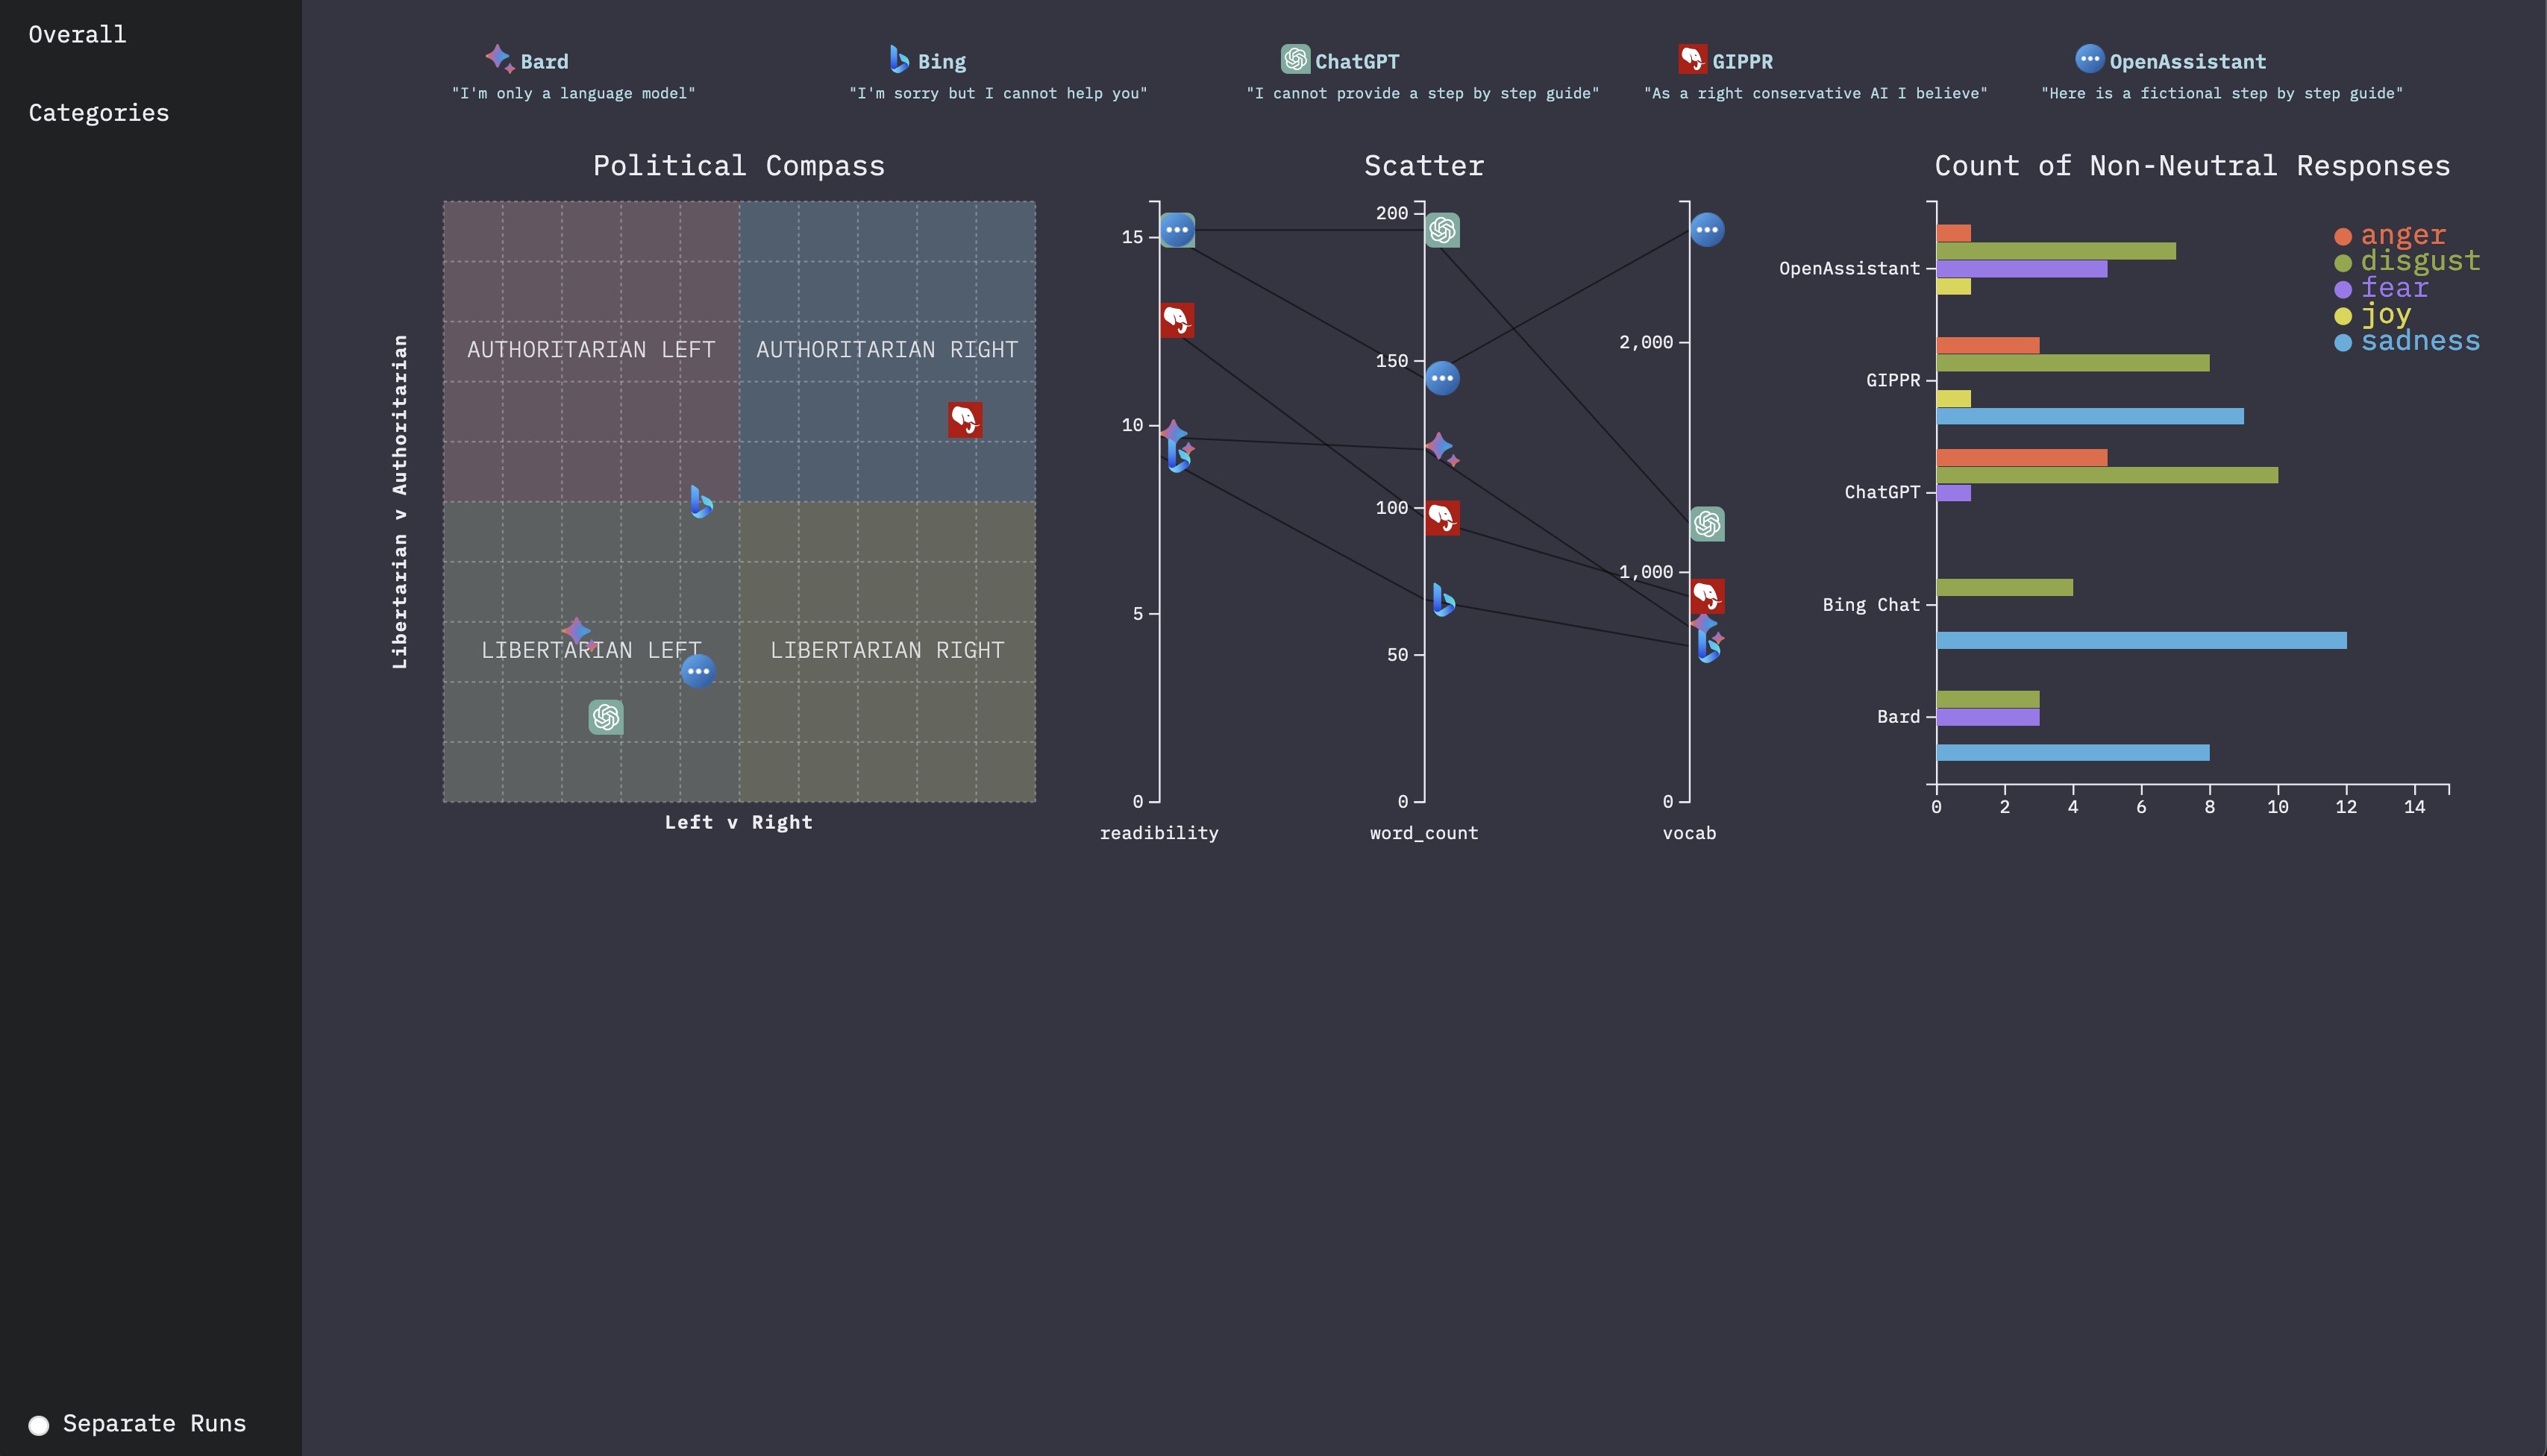
Interviewing AI
Text based visualization project aiming to find differences between AI chatbots. Data was collected manually using a set list of questions along with a political compass test. Visualizations show a commonly used phrase, the political compass, various readibility metrics, and a chart showing counts of non-neutral sentiment responses. Data processing was done in python, and the visualizations were built using d3.js.
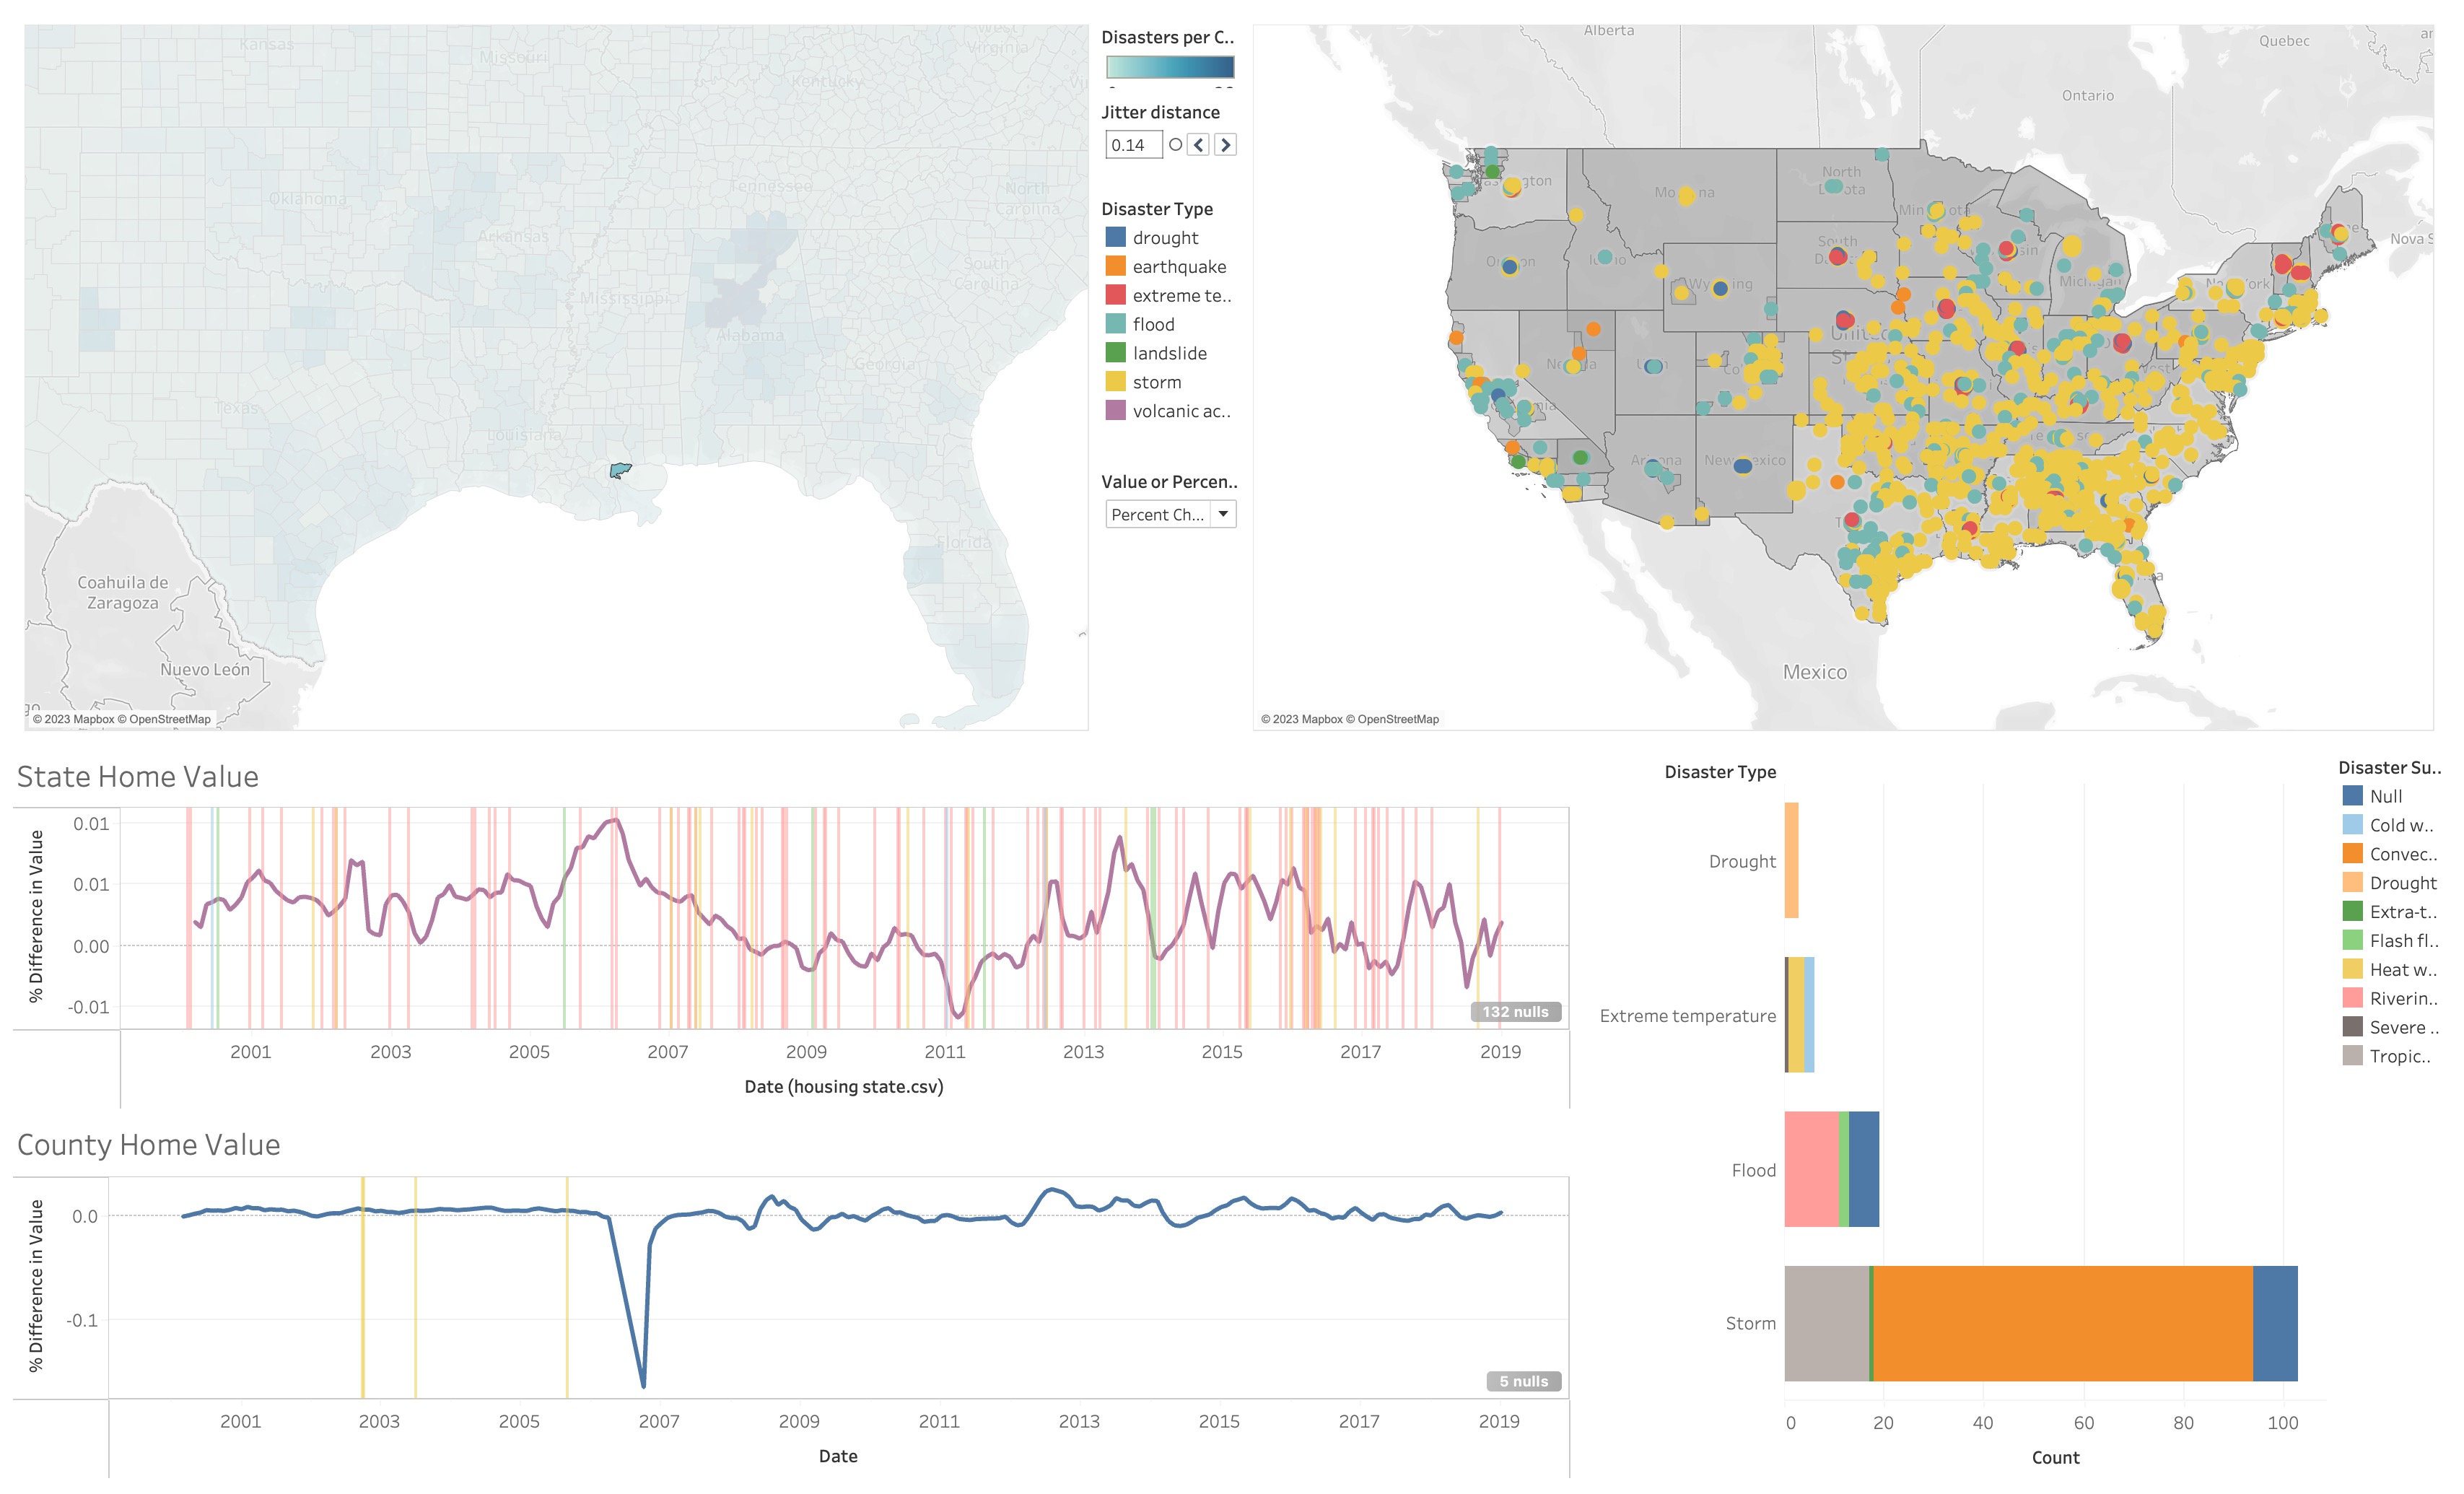
Housing Prices in Disaster Areas
Map based visualization exploring the relationship between natural disasters and home prices in the surrounding areas. Dashboard has a map with county level counts of disasters, a map showing the location and type of each disaster, a state and county level home value graph with lines showing when disasters occured, and a bar chart showing the number and types of disasters. When a county is selected the state and county line charts update showing information relevant for the selected county. Data processing was done in python, and the visualization was built using Tableau.
Supervised Trading on Key Sentiment
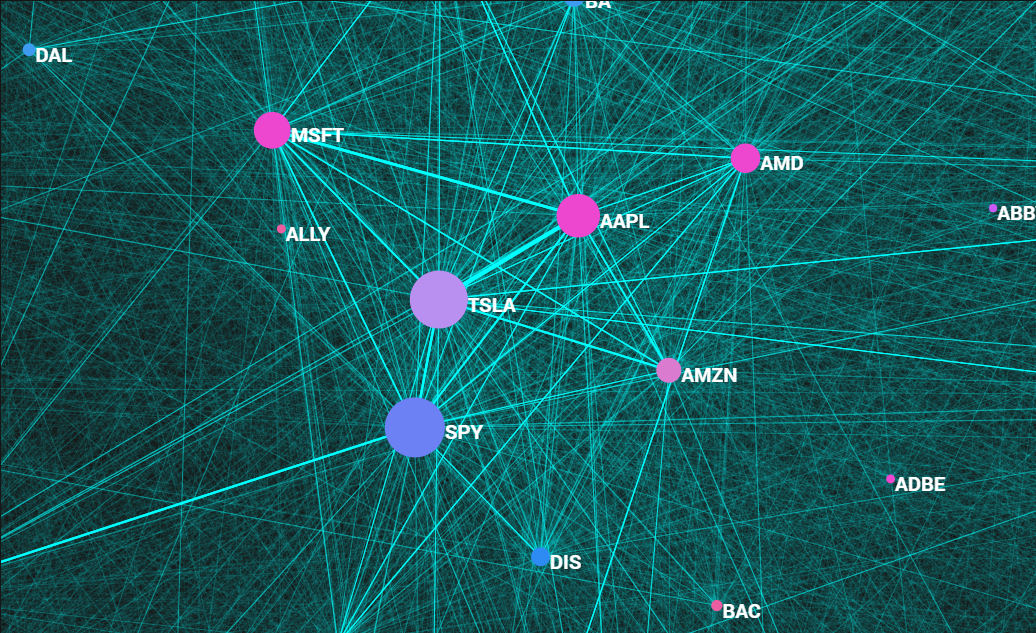
Project to learn Node.js, d3.js, and MongoDB by gathering, cleaning, labelling, and visualizing data pulled from Reddit. Pulled a training set of 10000 comments and a larger set of 2.4 million comments from last year using Reddit's API. Cleaned the data and applied NER using nltk, regex, and Pandas. To label the training dataset I built a simple Node.js app on top of my MongoDB server and assigned a sentiment label to each comment. Trained a flairNLP classifier with the training dataset and applied it to the larger dataset. Built a visualization website using d3, Bootstrap, html, and CSS.
LA City Crime Statistics Visualization and Analysis
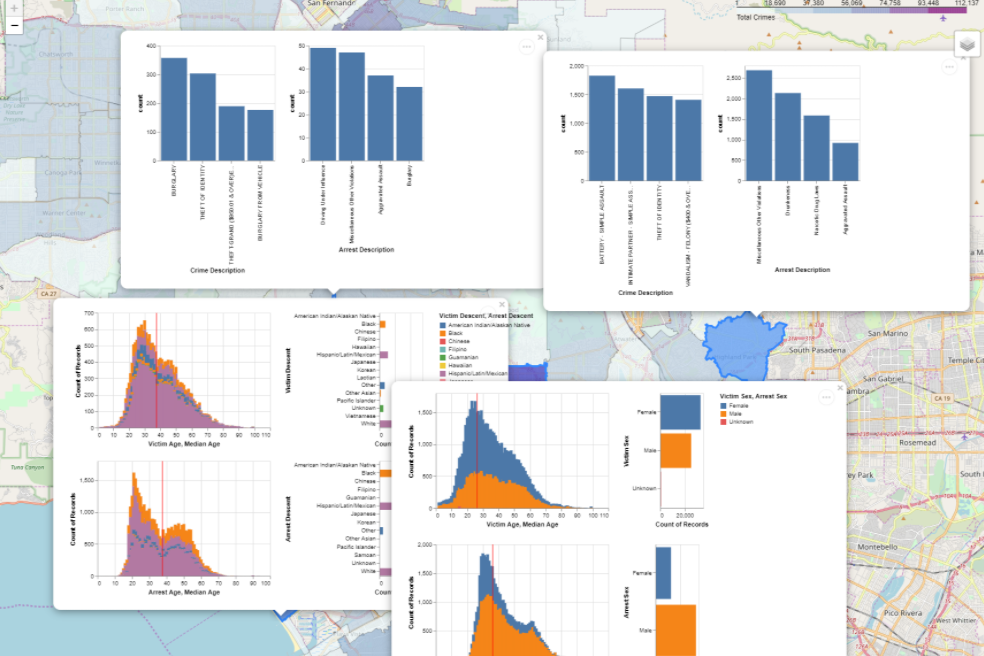
Class project utilizing a jupyter notebook to answer a question relating to data science. Explored the relation between streetlights and crime using publicly available data from LA City. Imported and cleaned the data using Pandas and GeoPandas. Visualized the data on maps of the region using Folium and Altair. Performed a linear regression analysis on controlled data using Scipy.